Astrometry: The Proper Motion of Barnard's Star |
||||||
| Astrometry is the art
and science of measuring the postions of celestial
objects. In the summer of 2009, I began to wonder what
the limit of CCD astrometric measurement might be. I
began to look for a project that would push the normal
"measure an asteroid" type astrometry to its
limits. AIP4Win has three software tools that make use of
astrometry: the Astrometry Tool, the Distance Tool, and
the Magnitude Measurement Tool. I decided to push them to
their limits. My test object was Barnard's Star. This otherwise inconspicuous red dwarf has an annual proper motion of 10.3 arcseconds per year. A change that large is easy to measure with conventional astrometry. The initial challenge was this: what is the shortest time interval that would allow me to detect -- unambiguously -- the proper motion of Barnard's Star. The answer turns out to be somewhere between five and seven days. By the time I completed the project in 2011, I found that with an ordinary 8-inch f/4 Newtonian, I could detect the movement of Barnard's Star from one night to the next! |
||||||
|
||||||
| To make a long story
short, I observed Barnard's Star on 20 nights in 2009 and
2010, taking a total of 836 images. On good nights, using
an data set of 60 images, or one hour of observing time,
I was able to determine the postion of Barnard's Star
relative to 11 background reference stars with an r.m.s.
error of ~10 milli-arcseconds. Over all observations,
good nights as well as bad, the r.m.s. error was 22 mas,
and the mean error in matching all postions with a model
based on HST measurments was 43 mas. In 2011 at the Society for Astronomical Sciences (SAS), I gave a talk and presented a paper on this Barnard's Star project. You can download these from: I have also posted a Powerpoint talk presented at the 2010 Northeast Astro Imaging Conference. This talk gives useful background on how I made the astrometric measurements. |
||||||
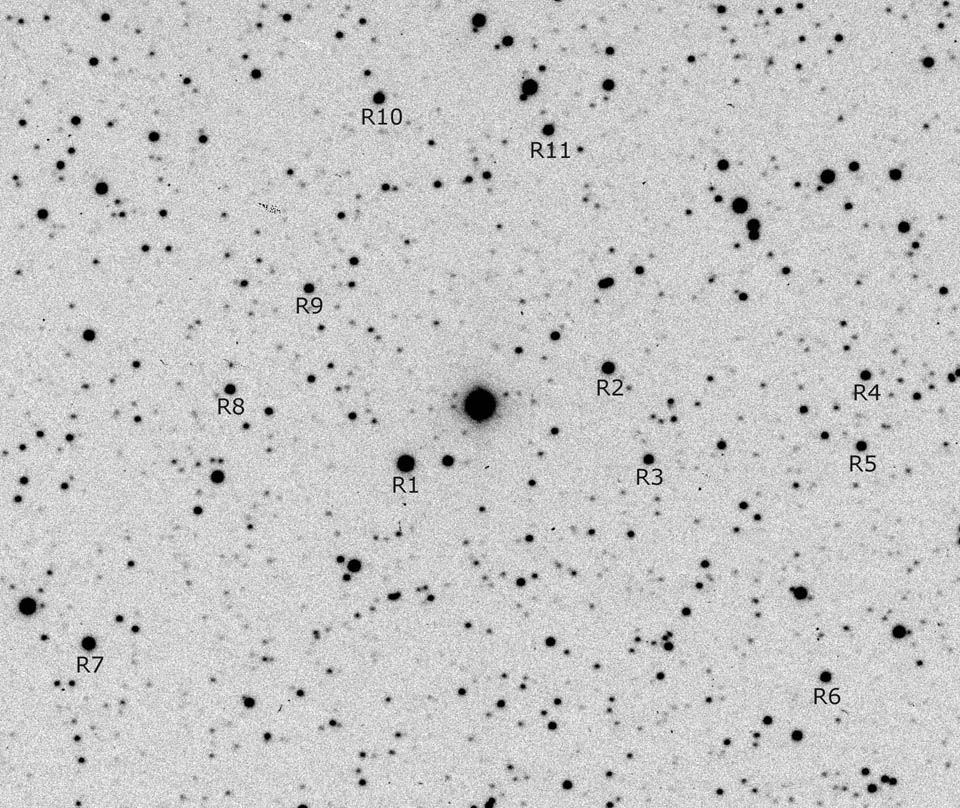
How I got Started on Barnard's Star... Barnard's Star is located in Ophiuchus a few degrees east of beta Ophiuchi, near the open cluster IC4665. Visually, it is a tenth magnitude star. I made a first group of observations on four nights in June/July 2009 from Alpaca Meadows Observatory and Pine Mountain Observatory. At Alpaca Meadows, I used an 8-inch f/4 Newtonian reflector plus ParaCorr coma corrector, and on Pine Mountain, a Celestron 11-inch f/10 EdgeHD. At both sites, I used my QSI 532ws CCD camera with a photometric V filter. Observations were reduced using AIP4Win v2.3.11 (beta) in debug mode, since the exercise was to serve the dual purposes of reducing the image data and debugging new features in the AIP4Win software. To make careful astrometric measurements, I selected 11 reference stars from the USNO UCAC2 catalog. Each star is reasonably well isolated from faint background stars and is available on images taken with the reflector and SCT. The astrometric residuals in RA and Dec were both close to 0.1 arcseconds. The reference stars are shown below: |
||||||
|
||||||
Barnard's Star: 17h 57m 47.98 +04d 43' 15.5 (J2000) 2009.646 epoch of observation |
||||||
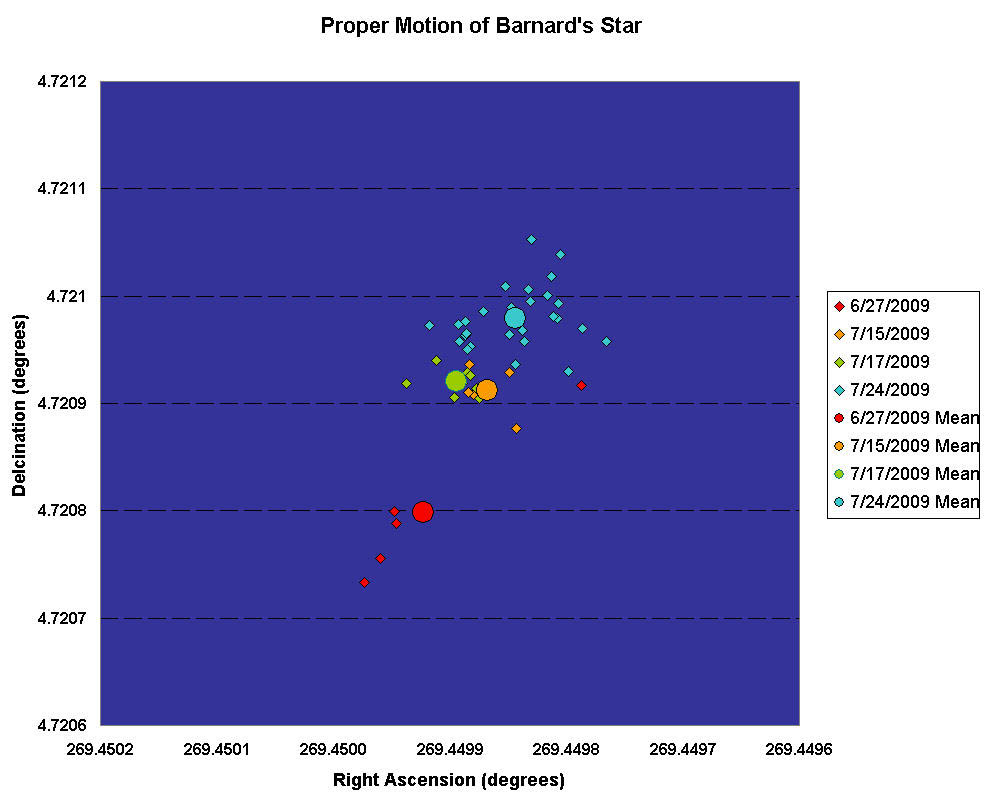
Barnard's Star is the bright object in the center. This image was made by summing a total of 48 images shot through the 11-inch EdgeHD using different color filters during the two nights on Pine Mountain. It shows much fainter stars than any of the individual images used for astrometry. Finally, using a new feature just added to the Magnitude Measurement Tool, I did astrometry on all of the images from all four Summer Workshop nights. I used every image, even those with very poor tracking. The results are summarized in an Excel graph below: |
||||||
|
||||||
| The
small diamonds in the graph show every image
individually. The large circles show the means for each
night. The table below gives the standard deviations in
arcseconds for each of the nights of observation. One
image in the June 27/28 group was poorly tracked and gave
a clearly outlying value. Both groups taken with the
11-inch SCT are tightly grouped. The July 24/25 group
shows an approximately uniform distribution of position
errors about the mean value. North is up; east is the the
left. Each major division on the axes is 0.0001 degrees =
0.36 arcseconds. The motion of Barnard's Star to the north and west is clearly visible in the plot. The northward motion is almost entirely due to proper motion; the westward motion is due to proper motion plus the shift due to trigonometric parallax. I expected this motion to stop and then reverse in the coming months. Two further nights' determination from Alpaca Meadows with the Vixen R200SS telescope extend the proper motion graph below. On August 16/17, I took 20 images of 50 seconds exposure eachwith the V filter; on August 24/24, I took another 20 images with 30 seconds exposure each, again, using the V filter. The August AIP4Win v2.3.15(beta) has new functions in the Magnitude Measurement Tool that simplify measuring coordinates from a series of images. In addition, more care in taking the images, especially insuring better focus and getting better tracking seemes to have resulted in considerably smaller standard deviations, as shown by the quantitatively in the table and qualitatively by tight clustering of individual points on the plot for each of the two nights. |
||||||
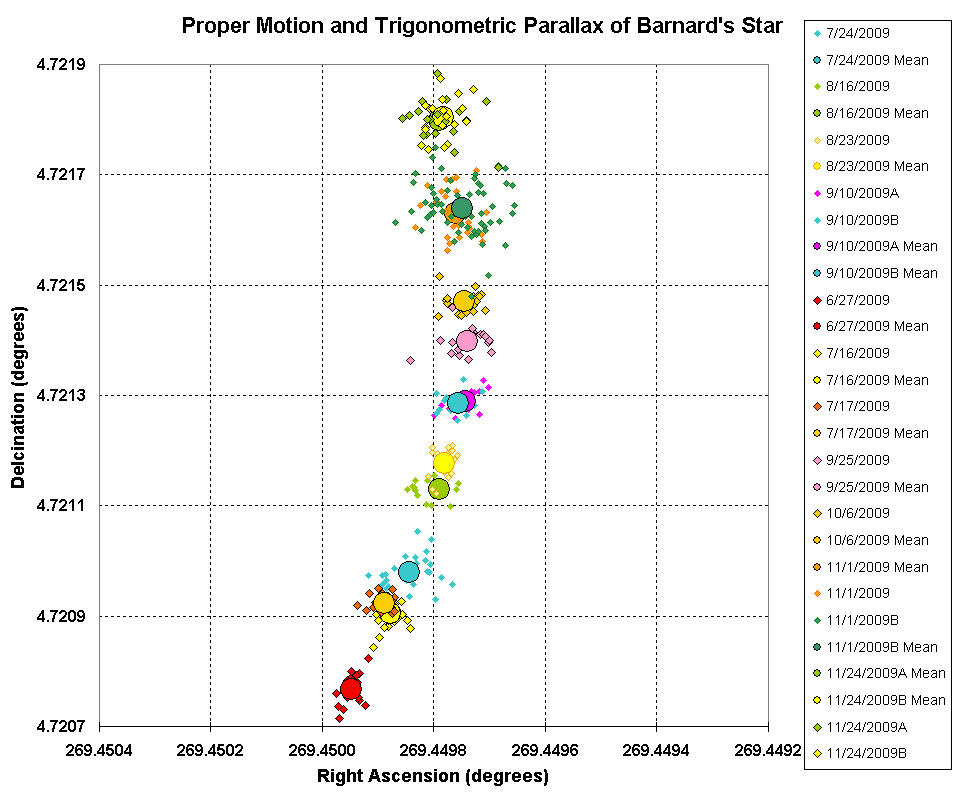
Results After One Summer's Observations... By 2009-12-12, Ophiuchus had sunk into the sunset, but I had gathered many nights of observations shown on the plot below. The curve to the left is exactly what should happen as the Earth moves around its orbit. I hope to pick up the star in morning sky in February or March when it will emerges from morning twilight.
These results were very encouraging. I continued observations of Barnard's Star through 2010, and in 2011 presented my preliminary results at the SAS meeting in Big Bear, CA. --Richard Berry |
||||||