Photometry of XX Cygni |
||||||||||||||||||||||||||||||||||||||||||||||||||||||||||||||||||||||||||||||||||||||||||||||||||||||||||||||||||||||||||||||
Richard
Berry, HAIP & AIP4Win |
||||||||||||||||||||||||||||||||||||||||||||||||||||||||||||||||||||||||||||||||||||||||||||||||||||||||||||||||||||||||||||||
Introduction |
||||||||||||||||||||||||||||||||||||||||||||||||||||||||||||||||||||||||||||||||||||||||||||||||||||||||||||||||||||||||||||||
| Beyond their
pictorial value, CCD images contain an abundance of
information about the brightness and position of
celestial objects. In this paper, we describe obtaining
and reducing CCD images during the 2009 Pine Mountain
Observatory Summer Research Workshop, held at the
University of Oregon's Pine Mountain Observatory located
25 miles east of Bend, Oregon. We came to the Workshop with a variety of goals. The authors from Willamette University wanted to explore gathering and reducing information from CCD images. Those from Celestron and Sidereal Technology wanted to check proper operation of mounts and telescopes, and the remaining author wanted to validate improved science-oriented functions under development in AIP4Win software. The 2009 PMO Summer Research Workshop brought us together in a productive and focused environment.A month before the Workshop, Berry selected an observing project that we could reasonably expect to complete in three days: to obtain a light curve and period for the short-period variable star XX Cygni. |
||||||||||||||||||||||||||||||||||||||||||||||||||||||||||||||||||||||||||||||||||||||||||||||||||||||||||||||||||||||||||||||
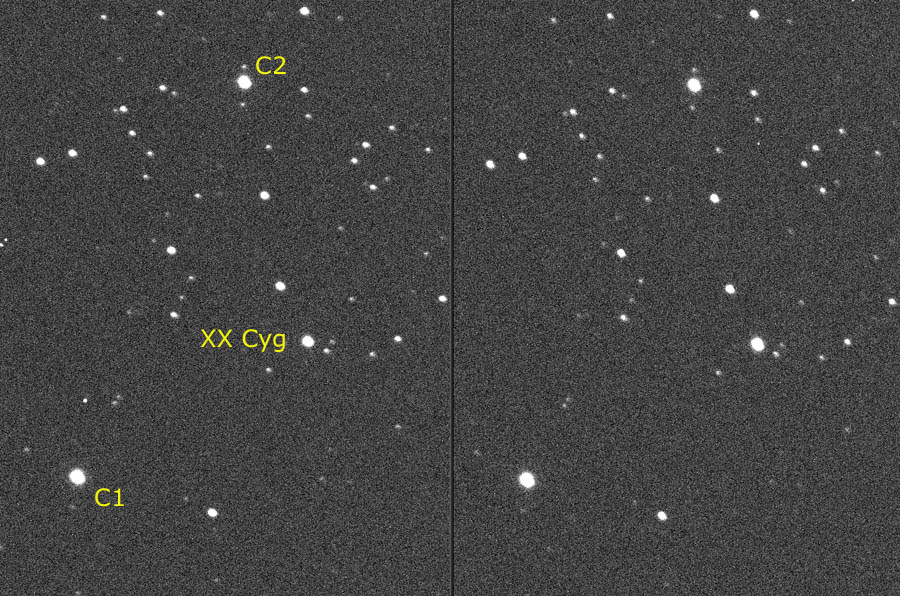
XX Cygni at minimum
(left) and maximum (right) light. XX Cygni is located at
20h03m16s, +58°57'17"(J2000.0). X Cygni |
||||||||||||||||||||||||||||||||||||||||||||||||||||||||||||||||||||||||||||||||||||||||||||||||||||||||||||||||||||||||||||||
| XX Cygni is a
dwarf Cepheid star (McNamera 1980) with a period of
0.1348 days (3.2 hours). It is usually assigned to the
metal-poor Population II subclass of SX PHE stars.
Discovered in 1904 (Ceraski 1904, Shapley 1915), the
pulsations of XX Cygni have been followed regularly ever
since. The star exhibits a range of variation of 0.84
magnitudes, from V = 11.36 to 12.20, and a mean radial
velocity is -108 km/sec with a range of 37 km/sec (Joner
1982). Its light curve appears to be monoperiodic (Hintz
1997), that is, it can be decomposed into a single
fundamental with a series of harmonic overtones. Hintz
finds no evidence that the star is a double-mode
variable; i.e., the star does not vary with two or more
periods. The star was interesting to us for two reasons. First, in the short time-frame available at the PMO Summer Research Workshop, we would be able to observe a complete light curve and determine the period of variation. Second, we would be able to integrate our observations into the evolving discussion of a possible secular change in its period. According to Shapley (1915), Erich Kron published a monograph on the star in 1912 that contained 2705 observations by eight different observers. From these data, Kron derived a period of 3h 14m 12s.35, (= 0.1348651 days) with the addition of a quadratic secular term. Quadratic terms in its ephemeris mean that the period of a star is increasing at a constant rate. Based on photographic photometry done at Mount Wilson, Shapley argued that the period, range, and shape of the light curve varied from cycle to cycle, but that the mean period was “sensibly constant.” XX Cygni was observed photographically until the early 1950s, and thereafter it was observed photoelectrically. In 1981, Szeidl and Mahdy of the Konkoly Observatory in Hungary published a monograph with 52 times of maximum light obtained by other observers and themselves. Concluding that the times of maximum could be interpreted as two eras of constant period separated by a sudden change in 1942, they proposed two separate ephemerides: Before 1942:HJDmax = 2,430,671.1010 + 0.134 865 026 E After 1942:HJDmax = 2,430,671.1010 + 0.134 865 113 E In these equations, E is the cycle number, with E = 0 at HJD (Heliocentric Julian Day) 2,430,671.1010. Their contention was that for 75 years the period had remained constant except for a single abrupt increase of 0.000 000 087 (87 x 10-9) days in 1942. In 2000, Kiss and Derakus revisited and extended the previous work on period variations in XX Cygni. Collecting and analyzing observations from the intervening years, they reaffirmed the main conclusion of since Szeidl and Mahdy, and offered a new ephemeris for the years since 1942: After 1942: HJDmax = 2,451,757.3984 + 0.134 865 135 E They attributed the star’s sudden jump in period to “nonlinear effects in pulsation” due to “mixing events in the semi-convective zone or slight overshooting at the convective core edge.” They stressed the importance of regular follow-up observations to monitor the period in hope of detecting more possible sudden changes. In 2003, Blake et al. attacked the two-era model. Citing Rodriguez et al. (1995) and Breger and Pamyatnykh (1998), they asserted that theoretically, period changes in dwarf Cepheids and SX PHE stars should exhibit increasing periods, and that period changes should be steady and continuous. “We have found,” Blake noted, “that the sudden jumps in period reported in the literature often seem to occur where there is a paucity of observational data.” In their paper, Blake et al. re-examined the older observations, replacing seasonally averaged times of maximum of the previous authors with individual times of maximum, and added 20 new maxima measured from CCD images. They offered the following quadratic fit to the enlarged dataset of maxima: HJDmax = 2,430,671.103 + 0.134 865 07 E + 2.86 x 10⁻¹³ E² The ephemeris implies a continuous steady increase in the period of the star’s pulsation. More recently, Derakus et al. (2008) offered an update on the period of XX Cygni, adding three new times of maximum. Their O-C diagram included both a linear and quadratic curve fit. They wrote, “we can conclude that the period of XX Cyg has been increasing at a same rate of the last few years. The residuals have no signs of any other change.[sic]” Our observations at the PMO Summer Research Workshop extend the composite O-C curve from all observers into 2009. From these data, we derived the following quadratic ephemeris: HJDmax = 2,430,671.1027 + 0.134 865 075 E + 2.53 x 10⁻¹³ E²
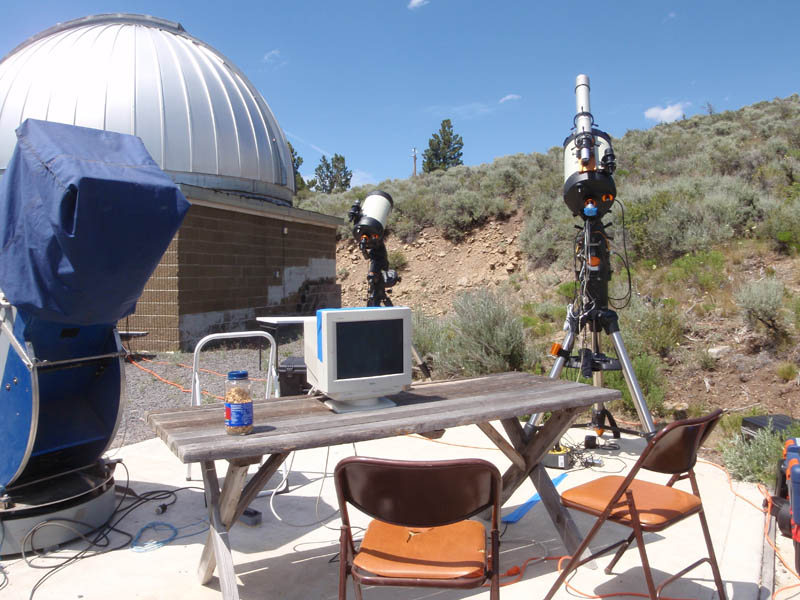
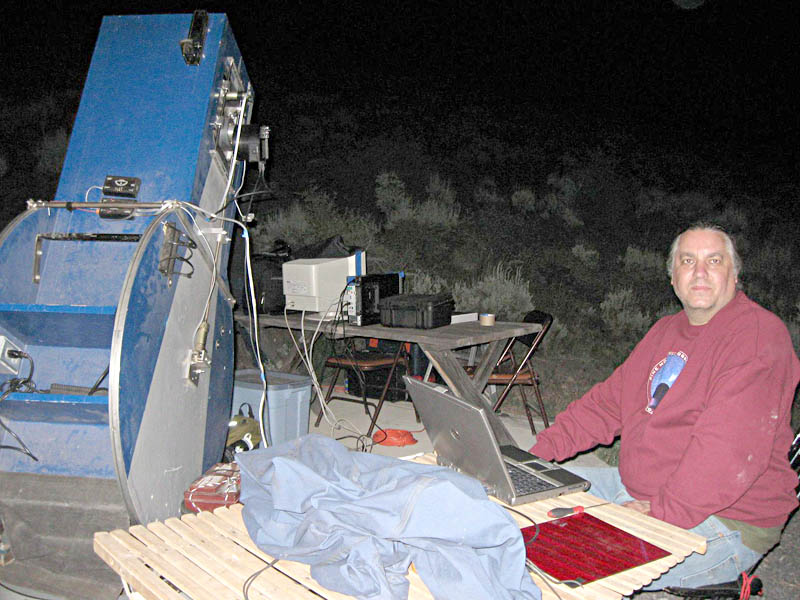
The observing site
in daylight, minus the computer and CCD camera. The
"lollipop" telescope is at left, |
||||||||||||||||||||||||||||||||||||||||||||||||||||||||||||||||||||||||||||||||||||||||||||||||||||||||||||||||||||||||||||||
Observations and Data Reductions |
||||||||||||||||||||||||||||||||||||||||||||||||||||||||||||||||||||||||||||||||||||||||||||||||||||||||||||||||||||||||||||||
| We observed XX Cygni on nine nights during June and July 2009. The first observing run was made in June by Berry to determine the feasibility of XX Cygni as an observing project. We made the next three observing runs at the Workshop proper, and Gray made the final five observing runs at PMO after the Workshop. During each observing run, we attempted to obtain CCD images of the variable and two comparison stars at the fastest cadence over the longest run possible, consistent with adequate signal-to-noise ratio and sky conditions. A journal of our observations is shown in Table 1. | ||||||||||||||||||||||||||||||||||||||||||||||||||||||||||||||||||||||||||||||||||||||||||||||||||||||||||||||||||||||||||||||
Table 1: Journal of Observations
|
||||||||||||||||||||||||||||||||||||||||||||||||||||||||||||||||||||||||||||||||||||||||||||||||||||||||||||||||||||||||||||||
| Images taken with the R200SS and EdgeHD telescopes were 50-second integrations spaced at 60-second intervals. Images taken with the “Lollipop” telescope were 5-second integrations spaced at 15-second intervals, with occasional gaps in coverage. | ||||||||||||||||||||||||||||||||||||||||||||||||||||||||||||||||||||||||||||||||||||||||||||||||||||||||||||||||||||||||||||||
| Green and
Rebol performed “first-look” differential
aperture photometry on the images taken July 15 and July
17 using the Multi-Image Photometry Tool in AIP4Win
v2.3.0. They used GSC 3948:2542 as the comparison star
(C1), and GSC 3948:2105 as the check star (C2). C1 is
slightly brighter than XX Cygni at mV = 10.38, and
somewhat redder (B-V = +0.63) than XX Cygni (average mV =
11.54, B-V = +0.3), but all observations were collected
at low airmass.
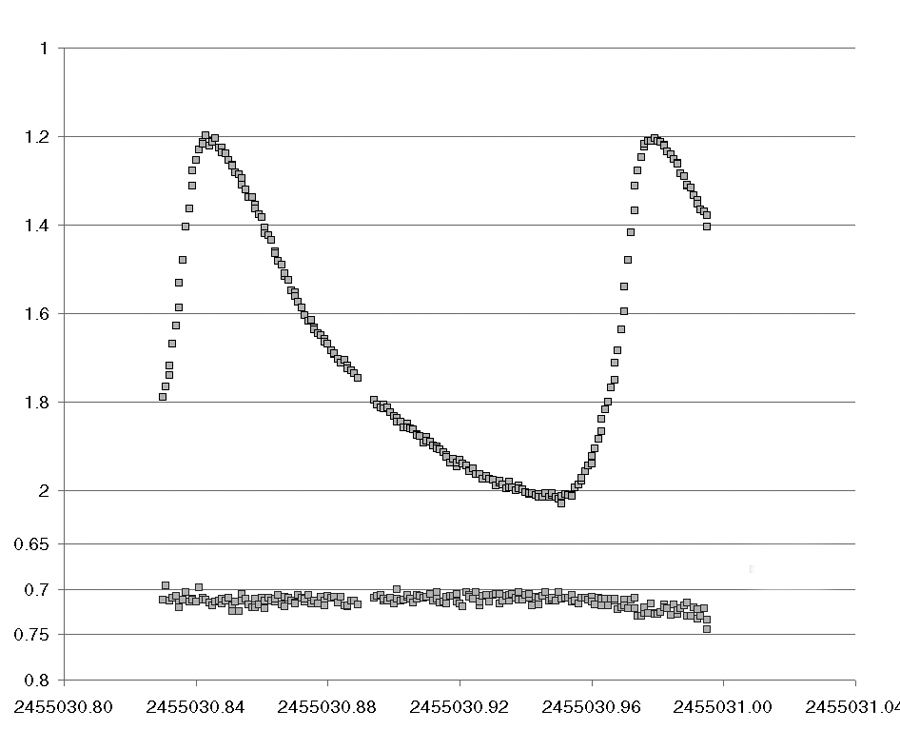
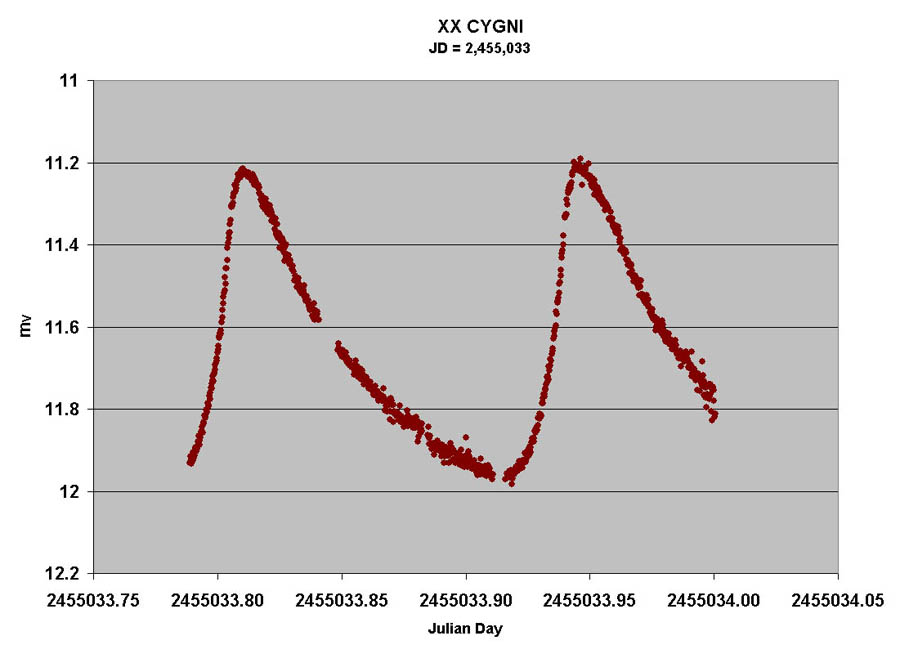
Here are the data
from July 17, showing the two peaks. The upper plot is
V-C1, and shows the Green and Rebol imported extracted magnitude data from those two days into Excel, and plotted Julian Day versus differential magnitude to obtain light curves. Although one maximum occurred in the July 15 run, two maxima were captured during the July 17 run. To determine the period, they created a duplicate set of data, then shifted the duplicates in time so as to plot the two maxima on top of one another. When a shift of 0.135 days was introduced, the two peaks coincided. Next, Green and Rebol added the curve from July 15 to the July 17 data, finding that when the maximum in the July 15 curve was shifted forward 2.022 days, it coincided with the second July 17 peak. See Figure 3. Dividing 2.022 days containing an unknown number of maxima by the 0.135-day period between the two adjacent maxima gave 14.98 cycles. Since the number of cycles between maxima must be an integer, dividing 2.022 days by 15 cycles gives a period of 0.1348 days.
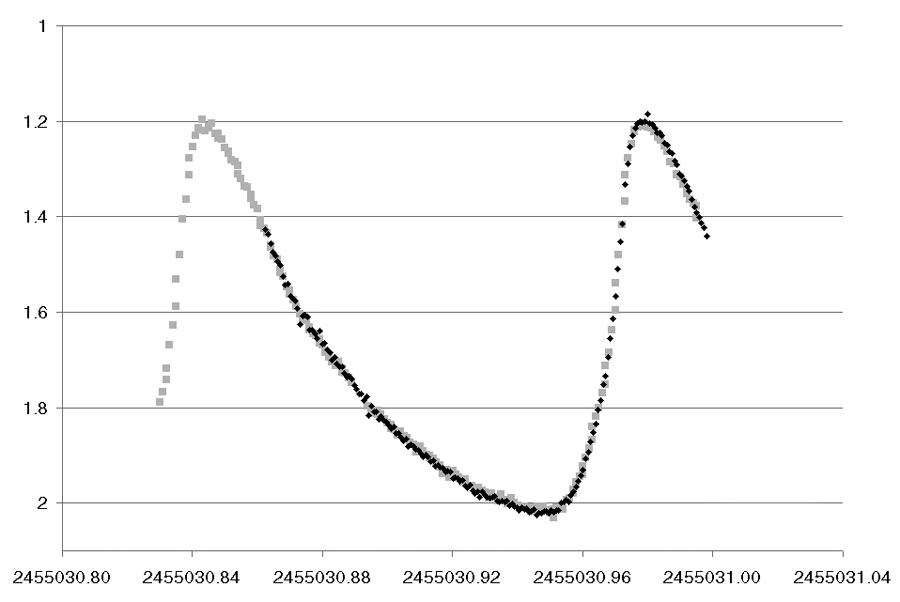
The gray points are
data from July 17, and the black points are data from
July 15 shifted Using Green and Rebol’s provisional period and a time of maximum obtained from the June 27 run, Berry found a difference between maxima of 20.0946 days over a span of 149 cycles, giving a more refined period of 0.134863 days. Bootstrapping from a single night’s observations with two maxima to two maxima two nights apart, and then using a time of maximum measured 149 cycles earlier gave the period of XX Cygni to about 0.015%. By the end of the Workshop, participants had captured just under 500 useable images containing four maxima, and derived an accurate period for XX Cygni.
Observations with
the Lollipop telescope -- a 5-second exposure taken every
15 seconds -- provided As the Workshop drew to an end, Medley, Green, Rebol, and Watkins departed. On August 20, Gray was conducting tracking tests of his unique “lollipop” telescope, and needed a convenient object to track. Berry suggested that XX Cygni would be a good choice. During the next five nights, Gray obtained over 4000 useable images of XX Cygni and the comparison stars, and captured seven more maxima.
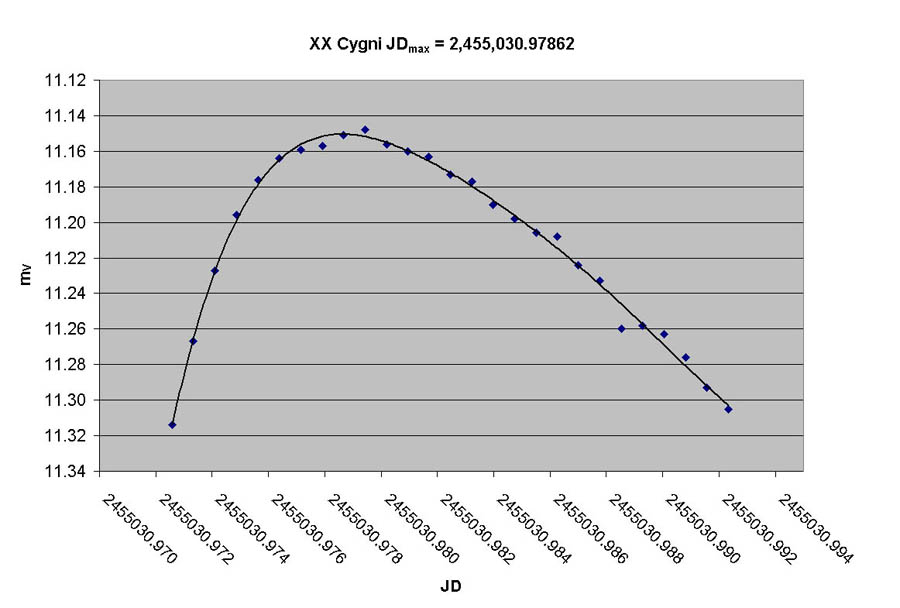
This graph shows a fifth-order polynomial fit to the July 17 second peak. Berry reduced all images using the Magnitude Measurement Tool in AIP4Win v.2.3.13(beta). The Julian Day time of maximum for each of the eleven maxima was determined using a fifth-order polynomial fit to all data points within 0.2 magnitudes of the peak magnitude, and times of maximum were converted to Heliocentric Julian Day. We report eleven new times of maximum in Table 2. |
||||||||||||||||||||||||||||||||||||||||||||||||||||||||||||||||||||||||||||||||||||||||||||||||||||||||||||||||||||||||||||||
|
||||||||||||||||||||||||||||||||||||||||||||||||||||||||||||||||||||||||||||||||||||||||||||||||||||||||||||||||||||||||||||||
Conclusions |
||||||||||||||||||||||||||||||||||||||||||||||||||||||||||||||||||||||||||||||||||||||||||||||||||||||||||||||||||||||||||||||
| In
association with the 2009 Pine Mountain Observatory
Summer Research Workshop, we performed time-series
photometry of the variable star XX Cygni, and added
eleven times of maximum to the 105-year accumulation of
data on the changing period of this pulsating variable
star. Our data support the conclusion that the period of
XX Cygni displays a steady and constant increase in
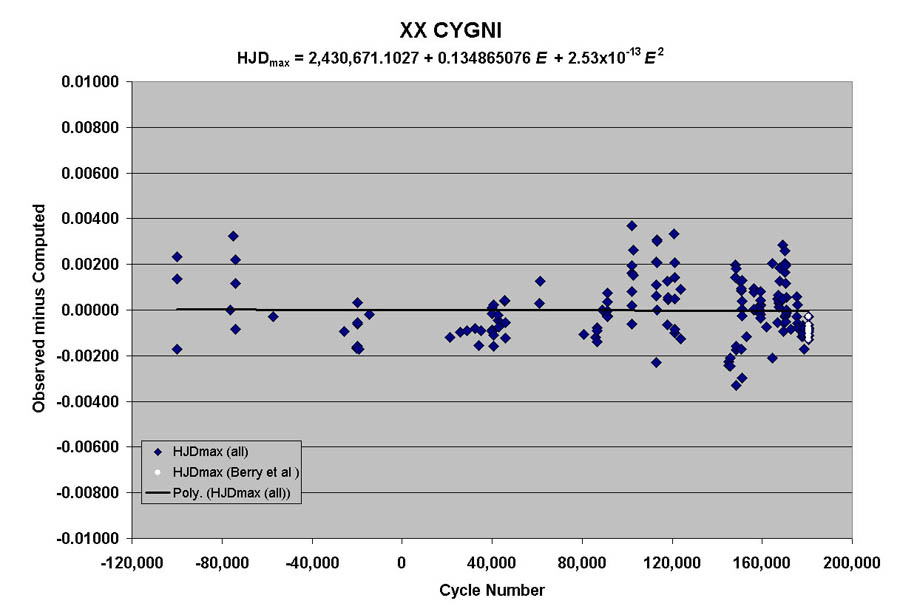
period amounting to 1 part in 10^8 per year. Our eleven new times of maximum add significantly to recent data on the variation of XX Cygni. We assembled 164 published times of maximum from the literature (Blake 2003, Agerer and Hübscher 2003, Hübscher 2005, Hübscher, Paschke, and Walter 2005, Bíró et al. 2005, Hübscher, Paschke, and Walter 2006, Klingenberg, Dvorak, and Robertson 2006, Hübscher 2007, Derakus et al. 2008, Hübscher, Steinbach, and Walter 2008, Hübscher, Steinbach, and Walter 2009). We discarded ten obviously discrepant maxima. Our eleven new maxima raise the total to 165 data points. Figure 5 shows the 105-year O-C history of XX Cygni’s variation using the quadratic ephemeris: HJDmax = 2,430,671.1027 + 0.134 865 075 E + 2.53 x 10⁻¹³ E² To create this plot in Excel, we performed a second-order polynomial fit to the data points, then adjusted the coefficients of the ephemeris until to polynomial fit appeared as a straight line. The plot depends very sensitively on the coefficients. A change of 5 x 10^-9 in the linear term or 0.02 in the quadratic term produce a noticeable departure from a straight line in the polynomial fit. Using observations from cycle 178,000 through our new maxima, we determined the current period to be 0.13486524 days. Our second-order term corresponds to a relative rate of change in the period (1/P)(dP/dt) = 1.02 x 10^-8 year^-1, slightly lower than the values reported by Blake (2003) and Derakus (2008). Examining the historical data, we note the presence of a considerable scatter in O-C, especially a tendency for O-C to become positive, i.e., for the observed time of maximum to be late relative to the computed ephemeris. We suspect this occurs when data points are collected at intervals greater than 60 seconds, causing the estimate of maximum to be retarded. |
||||||||||||||||||||||||||||||||||||||||||||||||||||||||||||||||||||||||||||||||||||||||||||||||||||||||||||||||||||||||||||||
The 105-year
history of variation in the period of XX Cygni is
summarized in this plot. Our maxima (in white, at the
right |
||||||||||||||||||||||||||||||||||||||||||||||||||||||||||||||||||||||||||||||||||||||||||||||||||||||||||||||||||||||||||||||
References |
||||||||||||||||||||||||||||||||||||||||||||||||||||||||||||||||||||||||||||||||||||||||||||||||||||||||||||||||||||||||||||||
| Agerer, F, and
Hübscher, J. 2003. IBVS, No.
5485. Berry, R., and Burnell, J. 2005. Handbook of Astronomical Image Processing, Second Edition. Willmann-Bell, Richmond, VA. Breger, M., and Pamyatnykh, A.A., 1998. Period Changes of ? Scuti stars and stellar evolution. A&A 332, 958-968. Blake, R.M., et al. 2003. Period Changes in SX Phoenicis Stars: XX Cygni. PASP, 115, 212-217. Bíró, I.B., et al. 2005. IBVS, No. 5643. Ceraski, W. 1904. Un nouvelle variable 14.1904 Cygni. Astronomische Nachrichten 165, 61. Derakus, A., et al. 2008. Binarity and multiperiodicity in high-amplitude delta Scuti stars. Submitted to MNRAS, accessed as arXiv:0812.2139v1. Hintz, E. and Joner, M.D. 1997. Fourier Decomposition of the Light Curves of Three Dwarf Cepheids: CY Aquarii, XX Cygni, and V798 Cygni. PASP, 109, 639-642. Hübscher, J. 2005. IBVS, No. 5643. Hübscher, J. 2007. IBVS, No. 5802. Hübscher, J., Paschke, A, and Walter, F. 2005. IBVS, No. 5657. Hübscher, J., Paschke, A, and Walter, F. 2006. IBVS, No. 5731. Hübscher, J., Steinbach, H.-M., and Walter, F. 2008. IBVS, No. 5830. Hübscher, J., Steinbach, H.-M., and Walter, F. 2009. IBVS, No. 5889. Joner, M.D., 1982. The Nature of the Dwarf Cepheid XX Cygni. PASP, 94, 289-298. Kiss, L.L. and Derakus, A. 2000. Period Variation of XX Cygni Revisited. IBVS, No. 4950. Klingenberg, G., Dvorak, S.W., and Robertson, C.W. 2006. IBVS, No. 5701. McNamera, D.H., and Feltz, K.A., Jr., 1980. A Photometric and Spectrographic Study of XX Cygni. PASP, 92, 195-201. Rodriguez, E., et al. 1995. Pulsation in high amplitude ? Scuti stars. A&A, 307, 539-541. Rodriguez, E., et al. 1995. Period Changes and evolution in the lower part of the Instability Strip, A&A, 299, 108-114. Rodriguez, E., and Breger, M. 2001. Delta Scuti and Related Stars: Analysis of the R00 Catalogue. A&A, 366, 178-196. Shapley, H., and Shapley, M.B., 1915. A Study of the Light Curve of XX Cygni. ApJ, 42, 148-162. Szeidl, B., and Mahdy, H. 1981. Period Changes in Dwarf Cepheids, II, YZ Boötis, XX Cygni, and DY Herculis. Communications of Konkoly Observatory, No. 75. Wils, P., et al., 2009. IBVS, No. 5878. |
||||||||||||||||||||||||||||||||||||||||||||||||||||||||||||||||||||||||||||||||||||||||||||||||||||||||||||||||||||||||||||||
Left to right: Berry, Rebol, Watkins, and Green, in the wee hours of the morning. |
||||||||||||||||||||||||||||||||||||||||||||||||||||||||||||||||||||||||||||||||||||||||||||||||||||||||||||||||||||||||||||||
Dan Gray and the 14-inch f/5.2 "lollipop" telescope. |
||||||||||||||||||||||||||||||||||||||||||||||||||||||||||||||||||||||||||||||||||||||||||||||||||||||||||||||||||||||||||||||
Light curve analysis at the picnic table. |
||||||||||||||||||||||||||||||||||||||||||||||||||||||||||||||||||||||||||||||||||||||||||||||||||||||||||||||||||||||||||||||
| --Richard Berry | ||||||||||||||||||||||||||||||||||||||||||||||||||||||||||||||||||||||||||||||||||||||||||||||||||||||||||||||||||||||||||||||
| Return to Richard Berry's Home Page | ||||||||||||||||||||||||||||||||||||||||||||||||||||||||||||||||||||||||||||||||||||||||||||||||||||||||||||||||||||||||||||||